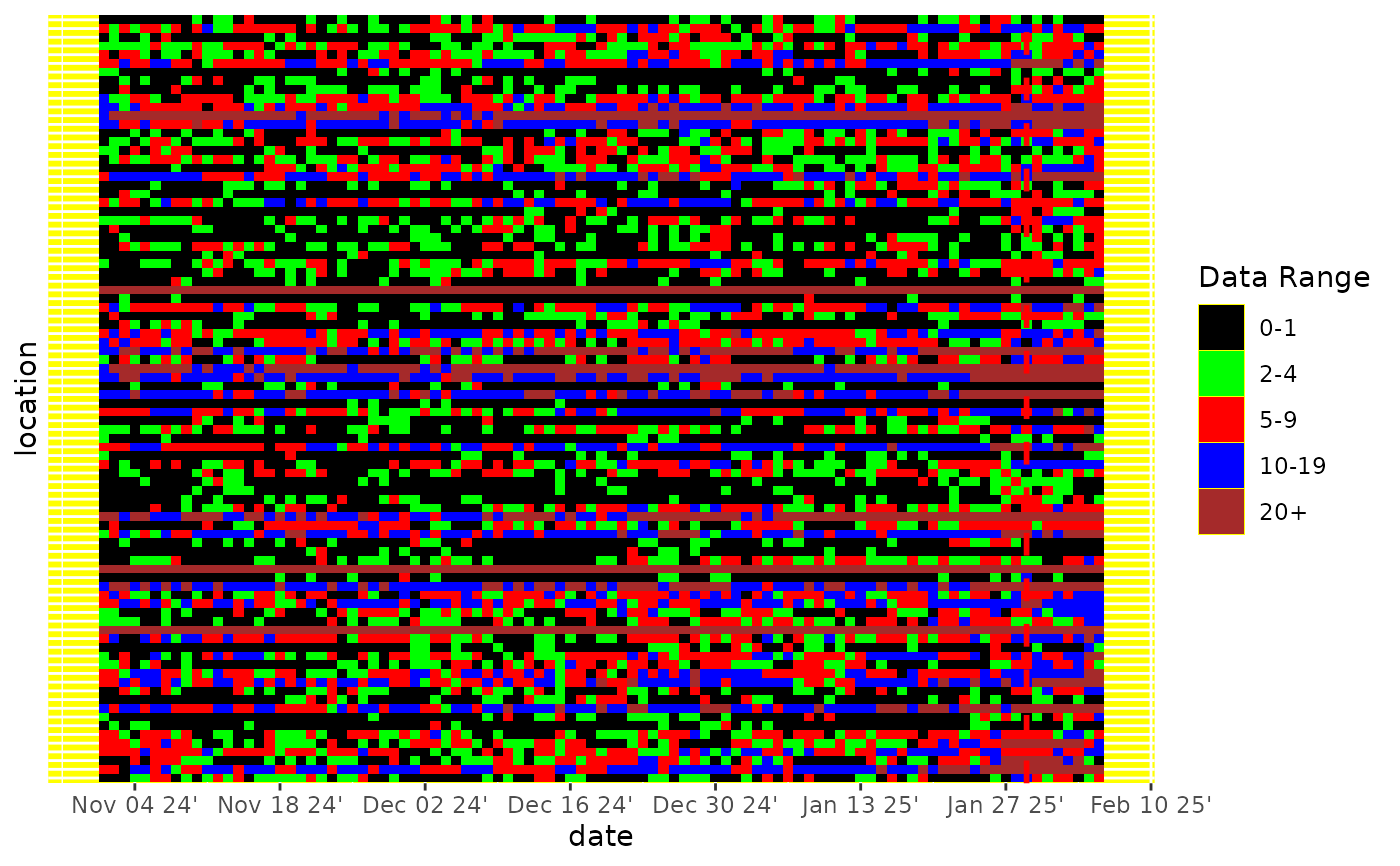
Generate a ggplot heatmap of count information by date and location given a frame of count-by-location-and-date data.
Usage
generate_heatmap(heatmap_data, plot_type = c("ggplot", "plotly"), ...)Examples
hd <- generate_heatmap_data(example_count_data)
generate_heatmap(hd)
 generate_heatmap(hd, plot_type = "plotly")